Justification for QA needing Network Monitoring software

– Why do you need this software?

We need a product that can confirm our lab networking is in good working condition. Also that can quickly and easially spot issues live while testing, and historcally keep needed data when a potential bug is found. This information can be included during the time the bug is filed to assist in justification that the bug is or is not in fact a product related issue.

– What is the business impact?

The impact is high. Currently when bugs are submitted that are not obvious bugs, frequently the bug is kicked back by the developer that it looks like a connectivity issue. We then spend a day gathering any info we can find and send it back. If the issue happens over the weekend then it can prove very hard to find the needed logs and we find our selves having to repro the bug, and for some, this can take a day or more if it is an uptime or scaled test. We find that we can lose 1-4 man days just in getting the needed info to show that there was in fact no connection issues between all the points in that specific testbed. This can equate to loss of man weeks in a release cycle. This product would allow us to attach the needed information when the bug is filed, therefore eliminating any need for Development to kick the bug back as a network connectivity issue.
Continue Reading

Show Advanced Graphs in PathSolutions TotalView

If you want the “Show Advanced” to always show up on all pages in TotalView, here’s the registry entry for that:

  1. Run RegEdit
  2. Navigate to HKEY_LOCAL_MACHINE/Software/Wow6432Node/NetLatency/SwitchMonitor
  3. Create a DWORD entry named DestWebAdvanced and set it to 1
  4. Stop and restart the PathSolutions Network Monitor service

At this point, “Show Advanced” will display on all interface pages by default.

Continue Reading

Enabling SNMP on Windows OS

STEP 1:
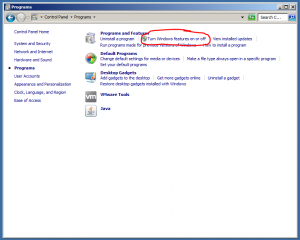
Open up the Control Panel and go to Programs.  Click on “Turn Windows features on or off”


STEP 2:
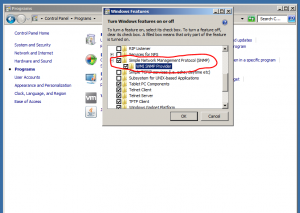
Check the box to enable SNMP.  Dont forget to enable the WMI as this adds additional OID’s for you to monitor.


STEP 3:
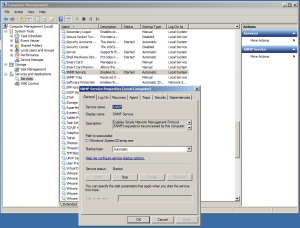
Open up SERVICES and find the SNMP Service and double click on it.  This will provide you with a Service Dialog box.


STEP 4:
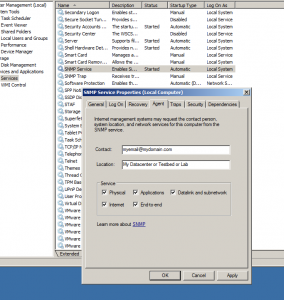
Click on the AGENT tab.  Type in your contact info (such as your email or phone number).  Type in the Location and/or Name of this server you are monitoring.  Make sure to select ALL check-boxes.


STEP 5:
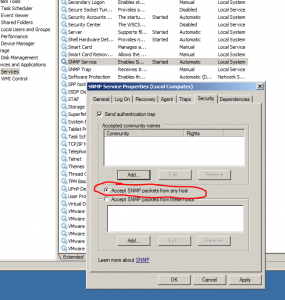
Click on the SECURITY tab and select the radio button that says “Accept SNMP packets from any host”

(NOTE: as long as you only set Read Only access to the Community string in Step 6, there is NO security risk)


STEP 6:
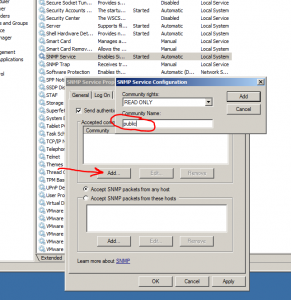
Click on The ADD button to add a new Community string.  My suggestion is to add a community string that is not the standard “public” community string.  Make up a string that fits your Company, department, etc…, and make sure you set it as READ ONLY!


STEP 7:
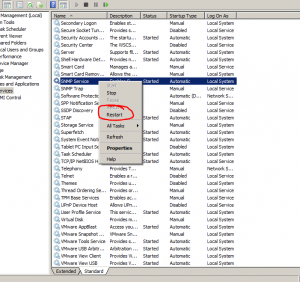
Open up the SERVICES window and you can now restart the SNMP service and you are ready to monitor your server!

(NOTE: you will need to enable port 161 for SNMP traffic if you have a firewall between your monitoring system and the server you just configured)


Continue Reading